AI | Biology | Biomarker | Technology
AI Drug Discovery from target to new molecular entities in 2 hours
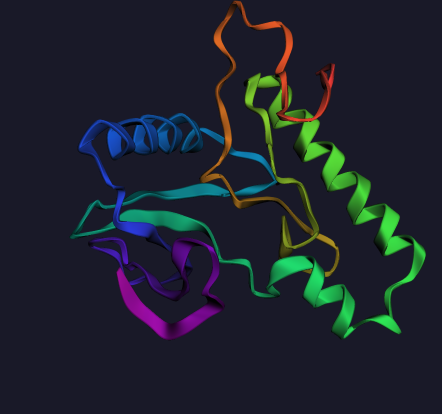
This was at Google’s offices in Cambridge, MA learning GCP and Google cloud framework while using AI tools for drug discovery. Thank you to the team members at Google, for helping me understand how to set up an AI workflow and discover drugs by targeting EGFR (Epidermal Growth Factor Receptor) kinase domain. This example is…