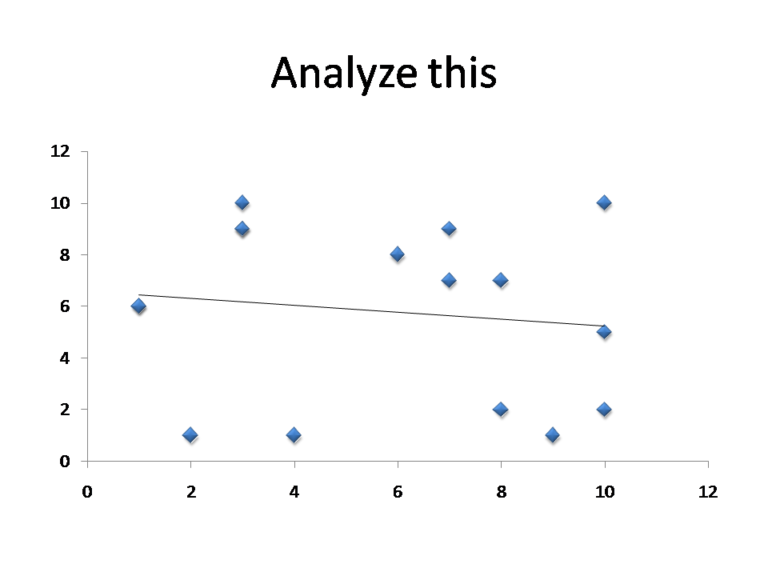
It is easy to get fooled by how the statistics interpret data. Sometimes, analysis of big data sets lead to conclusions that may not make sense. Also, the cause and effect do not work quite the same when the big data analysis shows a correlation. Just because there is a correlation does not mean that there is a cause and effect. Take the example of Kaggle… they ran a contest in 2012 on the quality of used cars and the characteristics of those cars. A used car dealer supplied the data to predict which cars were likely to have problems, their characteristics and what were the other cars that were not so likely to have problems. A correlation analysis showed that cars painted orange were far less prone to have defects – about half the rate of other cars. What has the car color got to do with problems? Color has no correlation and rightly so – this was just the chance event that was pulled out. But once, such a correlation between the car defects and color had been found out, the conclusions that can be drawn tends to get ridiculous. • Paint your car orange to have fewer defects. • Buy a orange car and your car will last longer, no matter how you treat it and forget about the oil change. • If you have an orange car, then you do not need to maintain the car. However, these conclusions get more complicated the more you use them. Even with the most complicated analysis, it is important to think about reason rather than believe everything that can be concluded.
Similar Posts
Enable drug discovery
Drug discovery is hard.Amazing to see the databases that are available for public access that enable drug discovery. Broad institute publishes The Connectivity map (CMAP)which is a database of gene signatures of transcriptional response to perturbation of many cell lines. This is incredible amount of data that is available in the public domain to be…
Statistical approaches
Scientists frequently use statistics to determine the validity of their results. Usually a statistician gets involved and then there are statistic tests that are run to test the hypothesis. Most frequently these statistics tests are run with one specific goal. Test to determine whether these observed phenomenon are just random events i.e. signal vs. noise….
New Data analysis estimates Heart attack risk
To estimate risk of a disease, the earliest method that scientist used were epidemiological data analysis. For example, in the 1950’s they found that smokers got an increased incidence of lung cancer. It took the society nearly 3 decades before it was generally accepted and warnings started being issued but that is another story. Currently,…