Dr Dharmendra Modha’s group at IBM has been simulating the whole brain one cell at a time. They started with cat brain simulation and have almost reached the whole brain simulation except it runs about 1542 times slower. This is a simulation of nearly 1.6 billion virtual neurons and 9 trillion synapses. The power consumption is surprisingly low and tells us that it is possible to simulate the human brain and hopefully, understand the human brain. Look at the website below to find out more…
Similar Posts
Cronbach’s alpha
A statistics concept that has been used for a specific purpose. This has been used to interpret how well the scales, surveys (or test items) function for determining a factor under consideration. It is used to determine reliability or the internal consistency of the test item. The surveys are used to measure things that are…
Searching for datasets
For anything Artificial Intelligence or Machine Learning, datasets are important and sometimes to tune the algorithms requires a dataset that is useful and valid.One search tool that many use is called “GOOGLE” but there is a specific link to search for datasets. https://datasetsearch.research.google.com/ Another site talks about the background of google search engine and other…
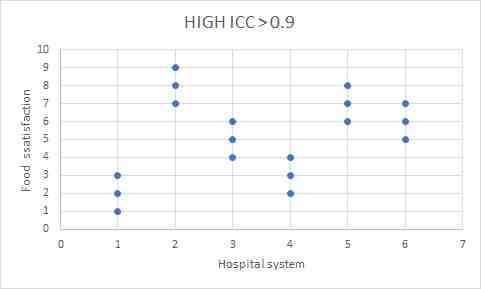
Intraclass coefficient and Clinical Trials
One technique that is used to compare two groups in statistics is to measure whether they are correlated or not – for example, if you are trying to correlate whether food consumption and weight gain are related to each other. There are several tests to tell you whether that is true or not. However, it…
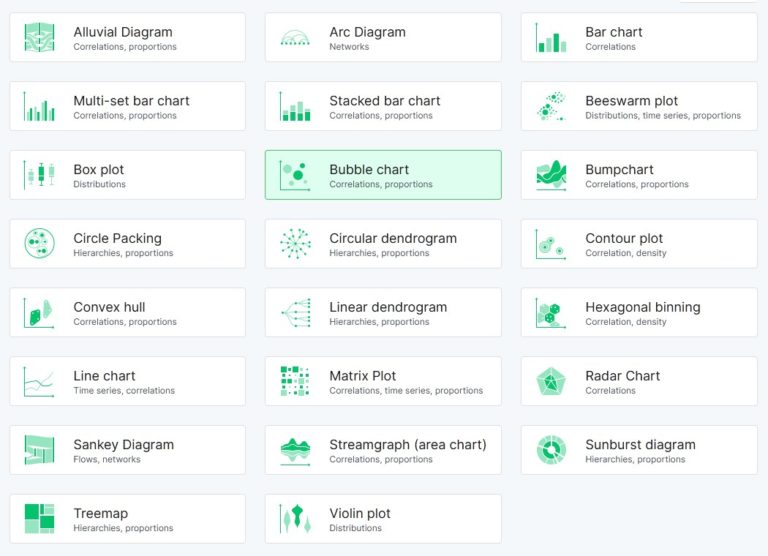
Data visualization: Rawgraphs
It is incredible to see the number of resources that are available for visualizing data. For most people it is a spreadsheet and the graphs it provides. Then there are dedicated programs that do all the data plotting in multiple styles for the user. These are complicated and involved programs that take the data from…
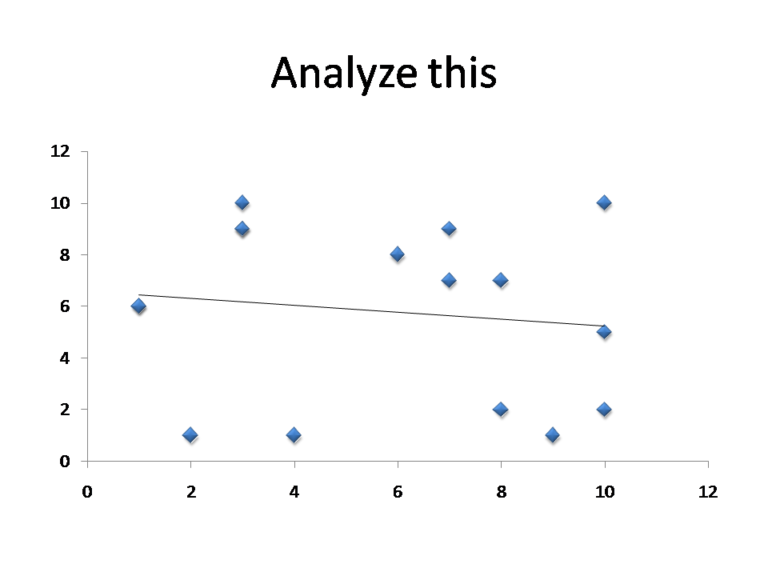
Statistical approaches
Scientists frequently use statistics to determine the validity of their results. Usually a statistician gets involved and then there are statistic tests that are run to test the hypothesis. Most frequently these statistics tests are run with one specific goal. Test to determine whether these observed phenomenon are just random events i.e. signal vs. noise….