Category: Data analysis and Big Data
-

Analyze biological data Mix-omics
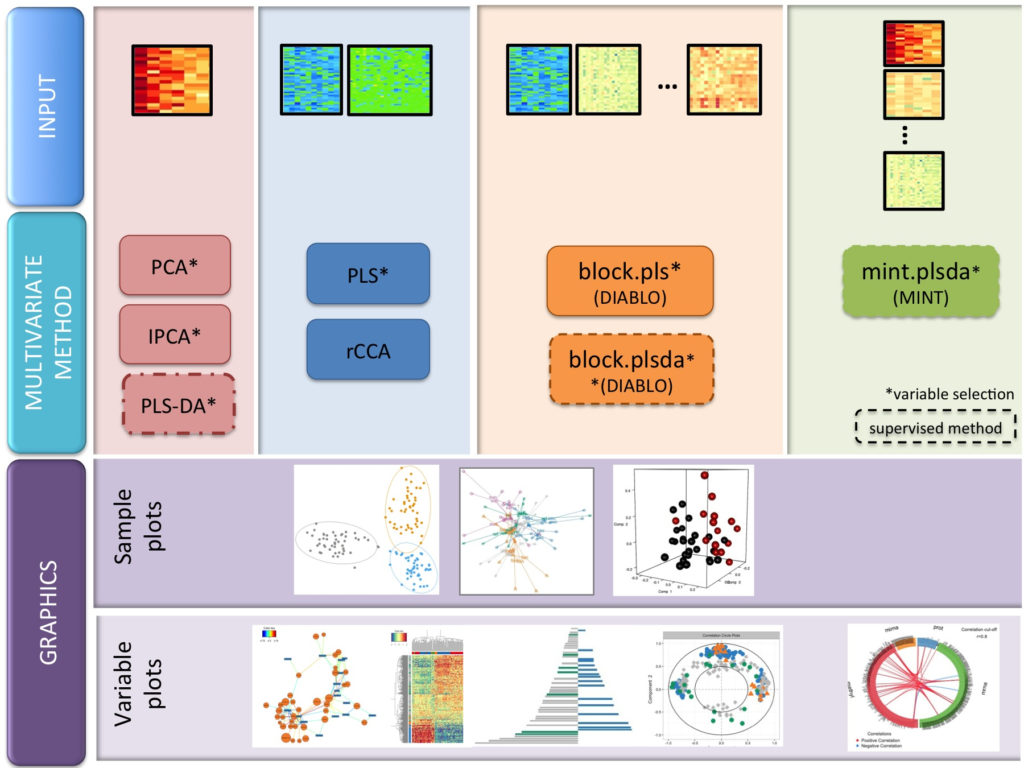
One of the oldest entrants in the integration, visualization and analysis of data from various sources (genotype, phenotype etc.,) is Mix-omics. http://mixomics.org/ The project started in 2009 and has been a continuously developed framework for multiple data sources. The graphic shows the multivariate methods available today for users. There is also sample data sets available…
-
Separating signal from the noise
Most analysis whether they are analyzing data from a clinical trial or whether they are trying to analyze images. Similarly, analysis of data requires separation of noise from the signal. In imaging one of the newer techniques of segmenting images is called Multicut. This is best explained in an article that was written for the…
-
Mathematics prizes
There have been a variety of prizes to solve problems that are practical such as space rocket. Some companies have made a business out of problem solving through mediating solvers and problem generators – such as those mediated by Innocentive. However, rarely are problems solved just for the sake of solution of the problem. One…
-
Compendium of open source biological software
This is just a short note that if you do any biological data analysis – whether it is sequence data, flow cytometry data or any other data then first look at Bioconductor website. This has open source data, mostly written in R, that enable you to see what is the process that is used to…
-
Difficult Quantitative Science for Biologists
Sometimes, Biology is difficult. There are so many factors that are not understood, things that cannot be controlled and complex systems that are hard to predict that it is difficult to understand the full consequences of common things like food, diet, exercise and all the other complicating factors in health. However, one area that gets…
-
Cancer cures through data sharing
Cancer is a difficult disease to manage but still difficult to treat. However, many people have many thoughts on what it takes to cure disease and cure it. Maybe, some of them are practical and others are no so practical, however, it will take a revolutionary approach to come up drug discovery paradigms that help…
-
Strange correlations in data can spook people
When anyone measures a lot of data and then correlates it with phenomenon seemingly unrelated to the data, seemingly some relationships become evident. Is there a cause and effect? – Not necessarily but it still is surprising on how it can be related. Consider the example correlation between the movie showed on TV and the…
-
Weave for data visualization
Data visualization requires special tools. The one that has been very useful is “Weave”, as a ridiculously powerful visualization tool. Instead of describing in detail, look at this video below showing the elections of UK and the link that gives all the features very well. {youtube}WHQeP4yQa9U{/youtube}
-
Three rules of visualizing large data sets
There are several ways to visualize data. The most commonly used could be Excel charts. However, when the data sets are complicated and large, the ability to display and chart the data is required to be given to the individual user or consumer, new techniques are required to plot the data. One such technique involves…
-
Mobile tools for analytics- charting and graphing on the road with Android
When you have a business website, it is important to track visitors, the places they visit, the hits you get and other analytics that tell you more about whether your content is relevant and whether there is information that is useful to visitors or customers. Most companies make it a part of their daily, weekly…