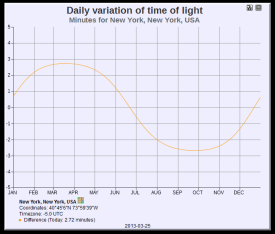
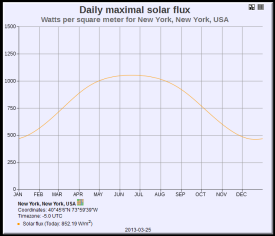
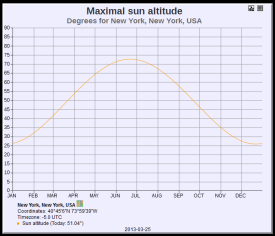
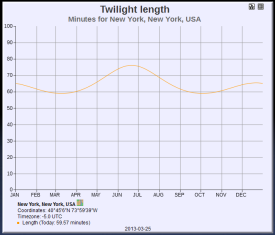
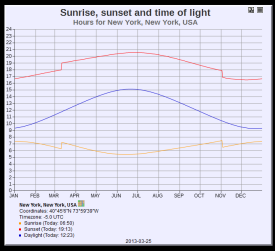
It is easy to see mathematics when you look at common things that we take for granted. For example the following pages were created from a website: http://ptaff.ca/soleil/?lang=en_CA. The raw data can also be got from the link below.
Take a look at these graphs and think about what can you see. Steven Strogatz saw mathematics and sine curves but it is also easy to see patterns that follow a distinct rhythm day after and day and year after year. It is also good to look at the data and see how it is possible to predict how long a particular day will be like and what is the probability that it will be hot. If nothing else, it is good for trying to figure out how your solar panel will function. Interesting to look at the time change when Daylight saving time (DST) comes into play.
